Journal · Survey
Can you count Christmas trees from space?
Watauga County is a top six Christmas tree producer in the United States, and nobody outside it can say how large the industry really is. We tried to measure it from orbit for nothing, and got most of it wrong.
Watauga County grows Christmas trees. Fraser fir accounts for about 96 per cent of North Carolina’s crop, the state is second in the nation by trees harvested, and Watauga sits in the top six producing counties in the United States.4
Ask how large that industry is and the public record does not agree with itself. For the neighbouring county with the largest crop in the country, figures reported during a single afternoon of searching ranged from $85 million to $144 million to $154 million a year. State acreage appears as both 38,000 and 40,000. These are not competing estimates of different things. They are the same quantity, self reported, aggregated, and repeated.
That is a measurement problem, and measurement problems are what satellites are for. So we tried to count the crop from orbit using only data that costs nothing. This is what happened, including the three quarters of it that did not work.
The instruments
Four public datasets, no payment, and no account required for three of them.
| Source | Resolution | Role | Terms |
|---|---|---|---|
| Sentinel-2, Copernicus1 | 10 m | Seasonal vegetation change | Free and open, commercial use permitted |
| NAIP aerial, USDA2 | 60 cm | Verification | Public domain |
| 3DEP lidar, USGS3 | 1 m derived | Canopy height | Public domain |
| County agricultural statistics4,5 | Aggregate | The figure being checked | Public |
The constraint in this kind of work is no longer getting data. It is noticing which apparently free source carries a licence that forbids the use you had in mind. Three sources were rejected during this survey on exactly that basis: a disaster imagery archive licensed for non-commercial use only, a major analysis platform whose free tier excludes companies, and an elevation portal that reserves its highest resolution products for academic accounts. Each had a public domain equivalent, so none of them cost anything except the time taken to read the terms.
Test one, winter
Fraser fir is evergreen. The Appalachian hardwood forest around it is not. In February a plantation should therefore glow against a leafless landscape, and the difference between a summer and a winter image should isolate the crop.
The imaging worked better than expected. Winter turned out to be the cleaner season: the February scene lost 0.01 per cent of its pixels to cloud, against 15.6 per cent for July. Snow and terrain shadow, the two obstacles we were most worried about, were not the problem. After masking cloud, shadow and snow in both scenes, 83.7 per cent of the study area was usable in both.
The signal was the problem. Median canopy greenness in winter came out at 0.22 against 0.59 in summer, and only 2.7 per cent of the landscape held a strong winter reading. The crop does not stand out on its own brightness, so the only usable form of the idea is the seasonal difference rather than the winter value.
What the filter actually found
Applied across Boone and Vilas, the seasonal filter flagged 726 hectares in 715 patches. We inspected the six largest at 60 centimetres. Four were golf courses. One was a pasture. One was a conifer block.
The cause is obvious in hindsight and was not anticipated by anyone here. Cool season turfgrass stays photosynthetically active through a North Carolina winter, exactly as a conifer does. The filter does not find evergreen trees. It finds everything that stays green in winter, and irrigated, mown, generously sized golf fairways sit at the top of that list.
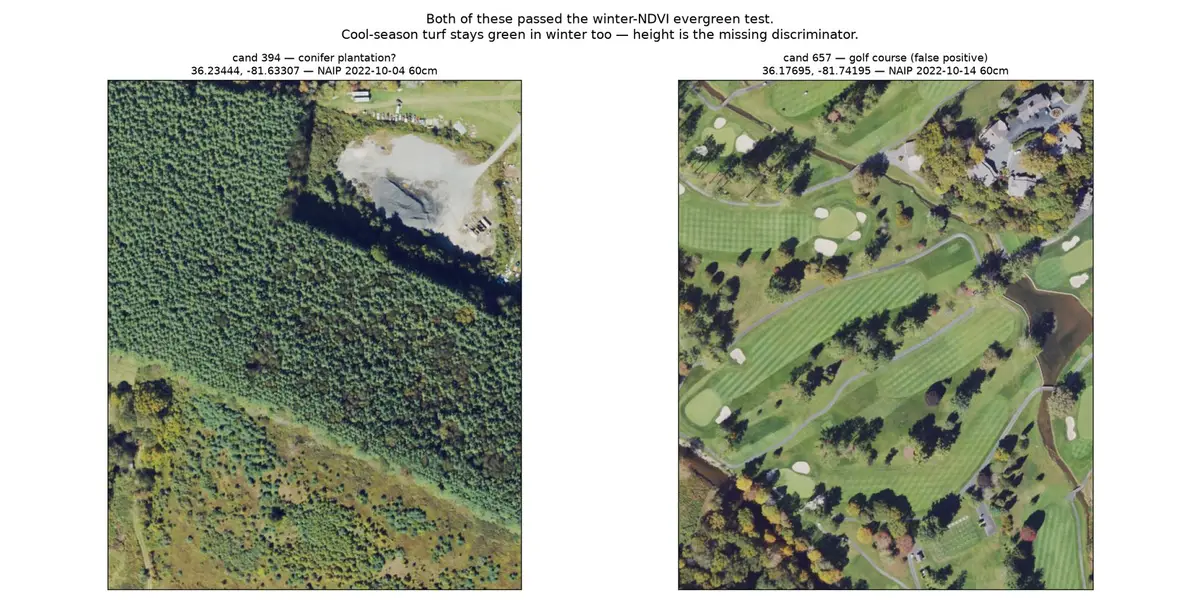
A satellite-only study would have reported those fairways as crop acreage.
Test two, height
Turf is zero metres tall, which makes laser altimetry the obvious discriminator. Watauga County is covered by 37.4 billion public lidar returns, free, with no authentication.
It separated them immediately. The golf course is 70.5 per cent bare ground beneath scattered specimen trees. Then the same measurement disqualified the one apparent success: the conifer block stands 20 to 25 metres tall, with 39.6 per cent of its canopy above 15 metres. Fraser fir is harvested at roughly two metres. That block is mature timber, not a Christmas tree crop.
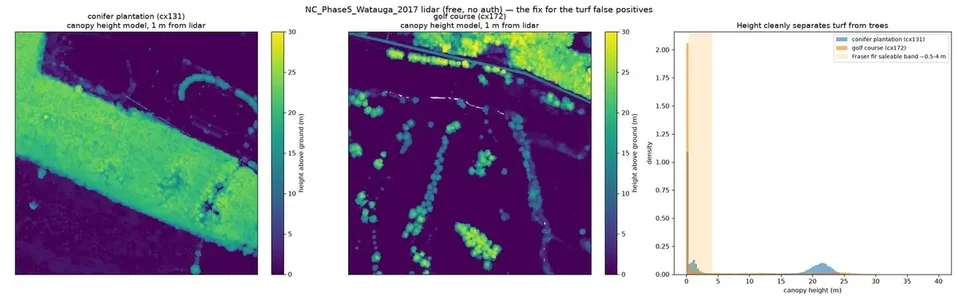
So the second test corrected the first and then removed its only positive result. At that point the survey had found 726 hectares of golf courses, pasture and timber, and zero confirmed Christmas trees.
Fraser fir is sold by height grade. The instrument that identifies the crop is therefore the same one that values it. That coincidence does not hold for most agricultural remote sensing, and it is the most useful thing this survey found.
Six real farms
Everything above was unsupervised: a search carried out with no confirmed example of the thing being searched for. Six operating choose and cut farms were then supplied as ground truth, four of them inside the study area.
Against those four, the seasonal filter scored two. Both hits barely cleared the threshold. Set beside its false positive rate, it is not a detector.
| Farm | Canopy 0.5 to 4 m | Largest planted block | Seasonal filter |
|---|---|---|---|
| A | 36.8% | 12.52 ha | Outside study area |
| E | 25.3% | 11.26 ha | Found |
| D | 9.1% | 1.63 ha | Missed |
| B | 8.9% | 0.84 ha | Missed |
| C | 7.9% | 0.28 ha | Found |
| F | 3.3% | 0.06 ha | Outside study area |
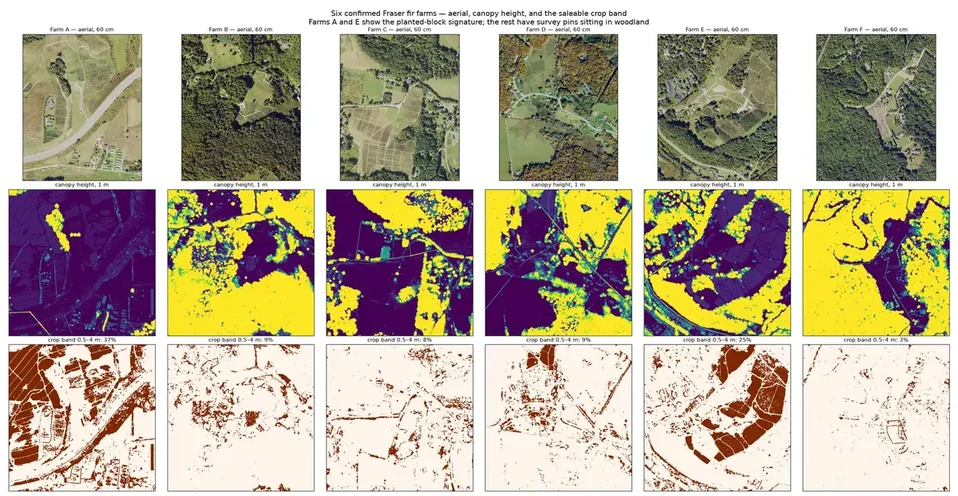
The encouraging part is in the bottom row of that figure. For two of the six, the saleable height band resolves into sharp rectangular planted blocks of 11 to 12 hectares. Neither mown turf nor natural forest produces that shape. The signature exists.
The weaker four are weaker for a reason worth stating plainly: a map pin marks a business, not a field. Four of these farms have their pin on a house or a farm stand set in woodland, so a box drawn around the pin measures trees that nobody planted. That is a property of the reference data, not of the farms.
What the data is good for
A negative result about one technique is not a negative result about the data. Four uses survived this survey intact.
Independent acreage measurement. Where official figures are self reported and published only in aggregate, a measurement taken from outside the reporting chain is a real check. The disagreement quoted at the top of this page is the reason to want one.
Crop grading. Canopy height maps onto price grade directly, so the same pass that locates a plantation estimates what is standing in it by height class.
Storm damage assessment. Public before and after imagery exists for the September 2024 hurricane across these counties, and canopy loss is measurable against a baseline far faster than ground survey. It needs the baseline to exist first, which is an argument for building one now rather than after the next storm.
Farmland conversion. Watauga County lost 23 per cent of its farms and 41 per cent of its farmland acreage between 2017 and 2022.5 Land use change at that scale is plainly visible from orbit, and is arguably the more consequential local story.
What this does not establish
It does not establish an acreage figure. No number here should be read as the Christmas tree acreage of Boone or Vilas. The 726 hectares is contaminated by turf and is an upper bound on a different quantity.
It does not establish that the planted block signature works. Two farms produced it. That is an encouraging sign, not evidence, and it has not been tested against the county.
The lidar is from 2017 and the aerial imagery from 2022. Fraser fir grows roughly 0.3 metres a year, so a tree in the saleable band in 2017 has been cut and replanted by 2022. The two cannot be compared naively, and any inventory built on this lidar describes the 2017 crop.
And nothing here has been walked. Every classification on this page comes from imagery. The cheapest remaining improvement to this survey is a drive, not a computer.
Zero. Every figure on this page was produced from public imagery and public lidar, on one laptop, with no subscription and no API key. The expensive parts of this work were reading licences and finding six farms.
Measurements taken 2026-10-19 over a study area bounded by 36.15 to 36.33 N and 81.60 to 81.85 W, from the sources below. Individual farms are identified by letter because the imagery is public but an inferred crop inventory is a commercial statement about a private business. Photographs are stock images and their locations are not verified; none of them is identified as a farm in Boone or Vilas.
- Copernicus Sentinel-2 Level-2A, scenes of 2025-02-24 and 2025-07-24, accessed through the Earth Search STAC API. Contains modified Copernicus Sentinel data 2025.
- USDA National Agriculture Imagery Program, 60 cm, 2022 flights, accessed through the Microsoft Planetary Computer STAC API. Public domain.
- USGS 3D Elevation Program lidar, collection NC_Phase5_Watauga_2017, 37,397,092,441 points, read from the public Entwine Point Tile bucket. Public domain.
- North Carolina Cooperative Extension, Christmas tree production figures, and regional press reporting of county industry value. The disagreement between these published figures is described above and is not resolved here.
- USDA Census of Agriculture 2022, Watauga County, farm count and farmland acreage change 2017 to 2022.